API Discovery (CLI)
API Discovery is the process of documenting APIs by scanning source code without prior knowledge of the code base.
Security teams, development teams, and platform engineers can all benefit from illuminating their APIs and automatically generating OpenAPI (a.k.a. Swagger) documentation and using it for development or testing purposes.
Prerequisites
Section titled “Prerequisites”Install the NightVision CLI. Follow the guide here to install the NightVision CLI on your system: Installing the CLI
Tutorial
Section titled “Tutorial”In this tutorial, you’ll download Broken Flask, create the relevant resources in NightVision, and test the API.
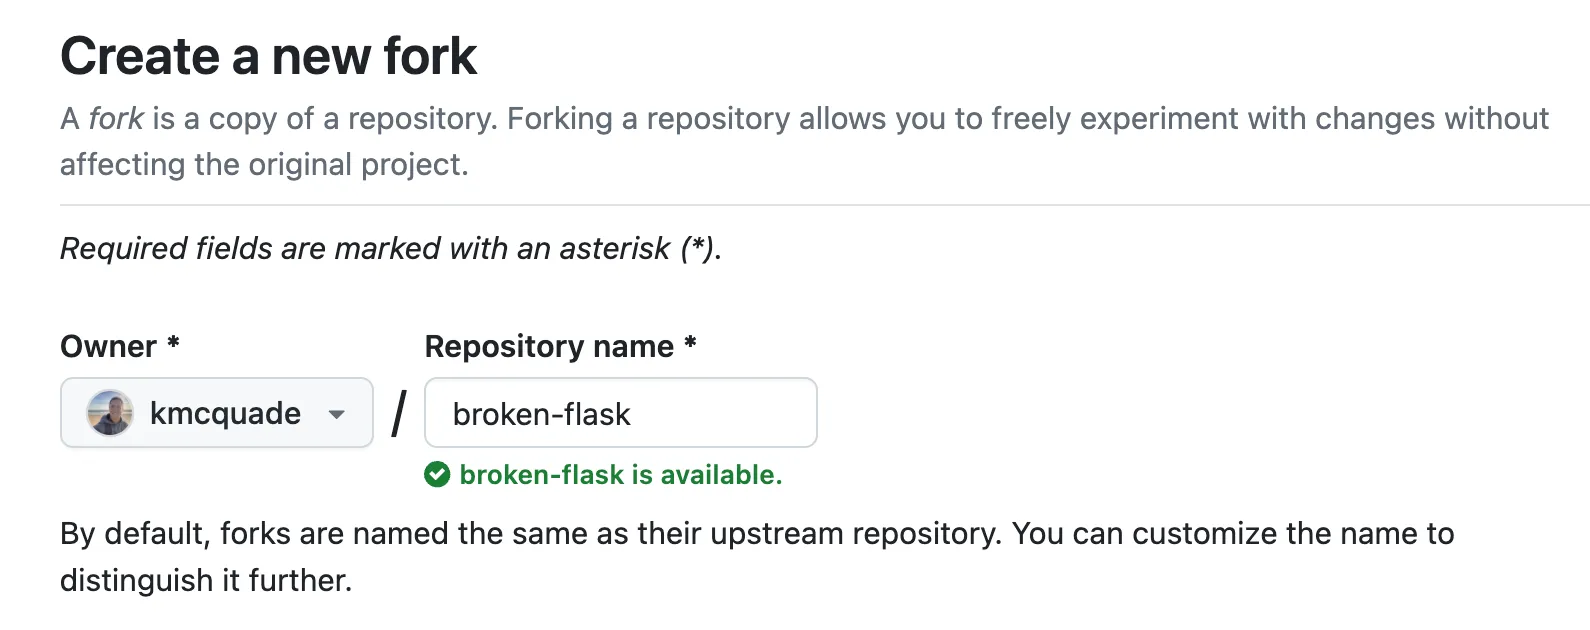
First, fork the repository to your GitHub account by clicking this link: https://github.com/nvsecurity/broken-flask/fork
Clone the repository:
# Change this to your GitHub usernameexport GITHUB_USER=YourUsername
git clone https://github.com/$GITHUB_USER/broken-flaskcd broken-flask
(1) Start the app
Section titled “(1) Start the app”You’ll need to start the app locally so you can scan it. Launch the app with Docker compose:
docker compose up -dNote: If you don’t have Docker installed, the best way to install it is by installing Docker Desktop.
(2) Create the Target
Section titled “(2) Create the Target”Create the Target inside NightVision.
nightvision target create broken-flask-api http://localhost:4000 --type API(3) API Discovery
Section titled “(3) API Discovery”Next, perform the API discovery by running the following command.
nightvision swagger extract . --target broken-flask-api --lang pythonNote: The
--targetflag will attach the resulting Swagger file to the Target resource you created
(4) Run the scan
Section titled “(4) Run the scan”Now run the scan:
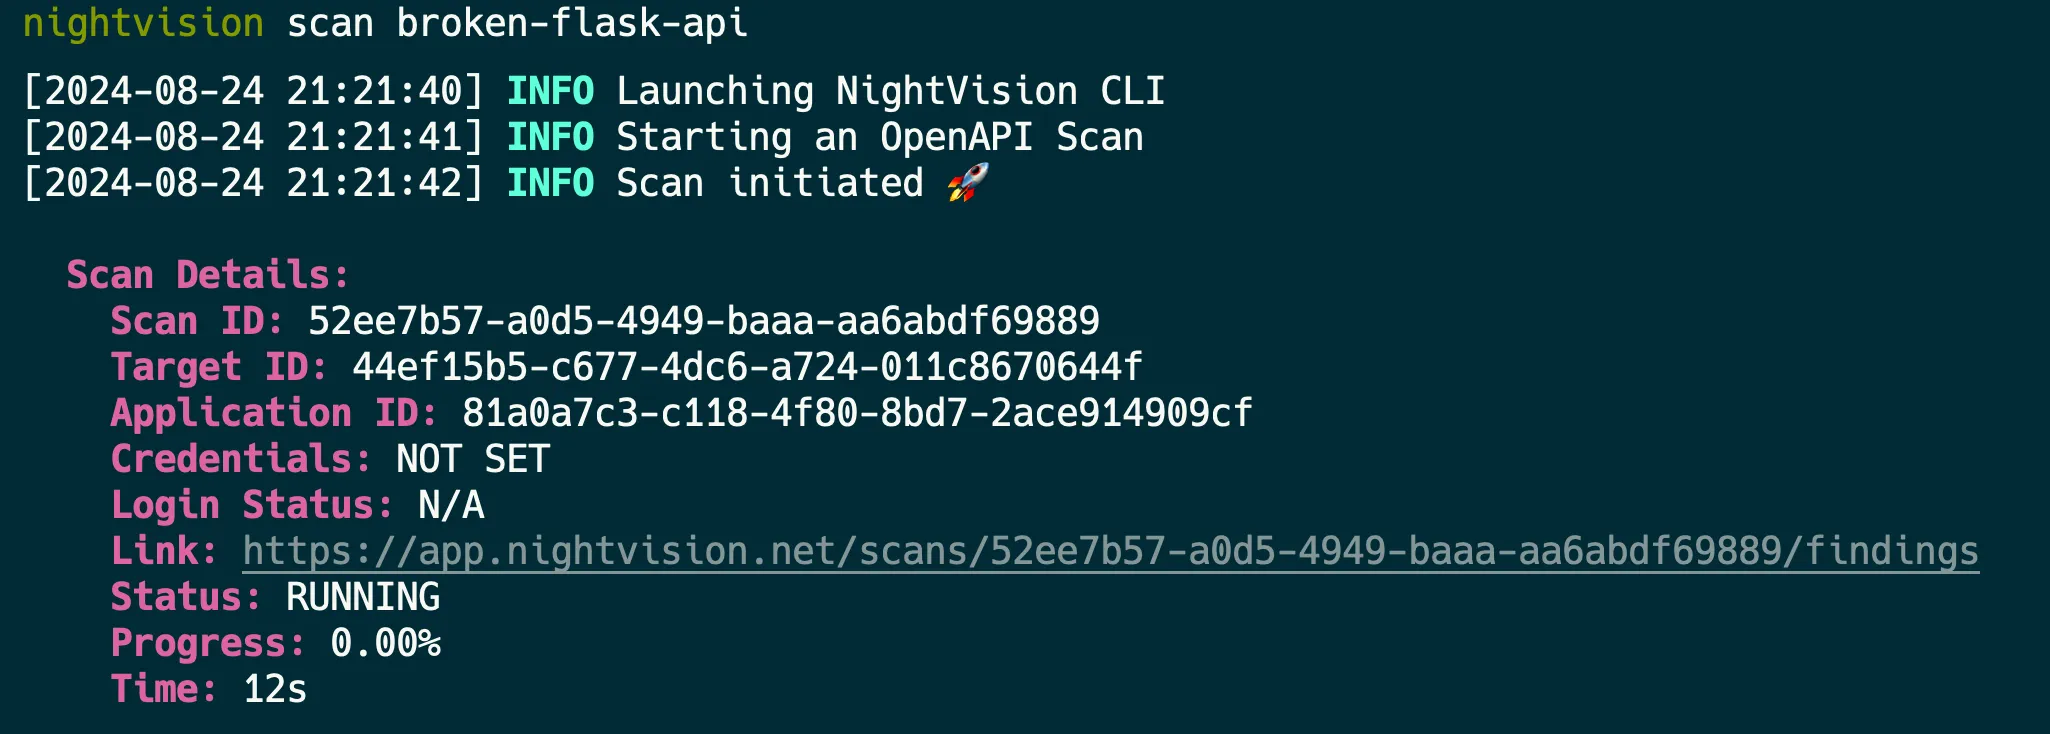
nightvision scan broken-flask-apiIt will launch a scan. You can monitor the progress by clicking on the link to the scan.
(5) View Scan Results
Section titled “(5) View Scan Results”Once the scan is completed, the results will be opened in your web browser.
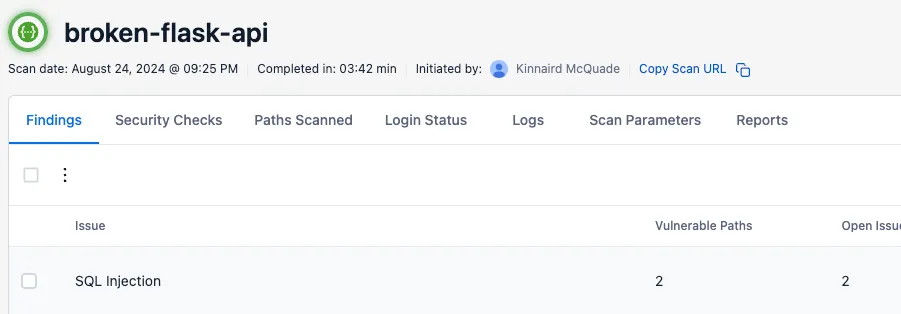
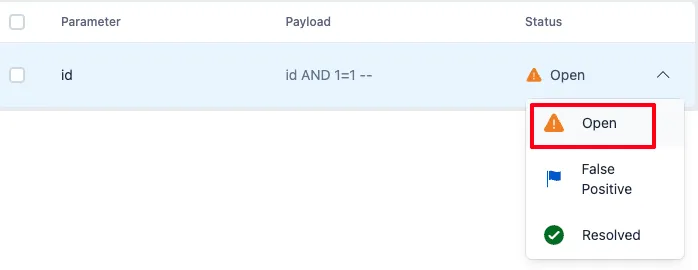
If you click on an issue, you’ll see a list of the URL paths, parameters, and payloads for a vulnerability type.
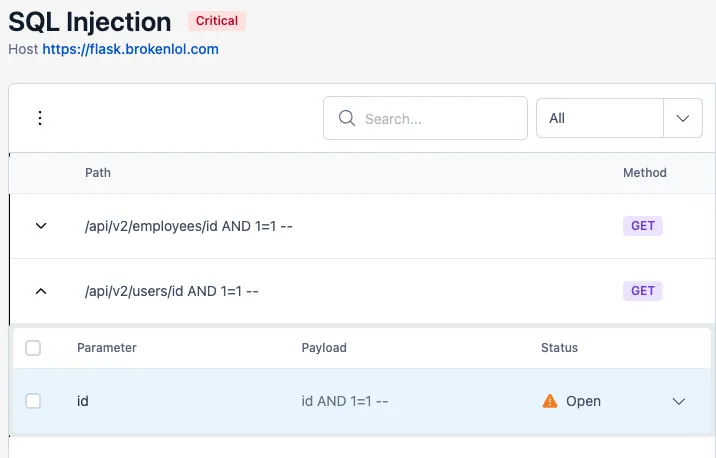
You can also click on the Status dropdown to mark an issue as ⚠️Open, 🚩False Positive , or ✅Resolved
When you click on an issue instance, you’ll see more details:
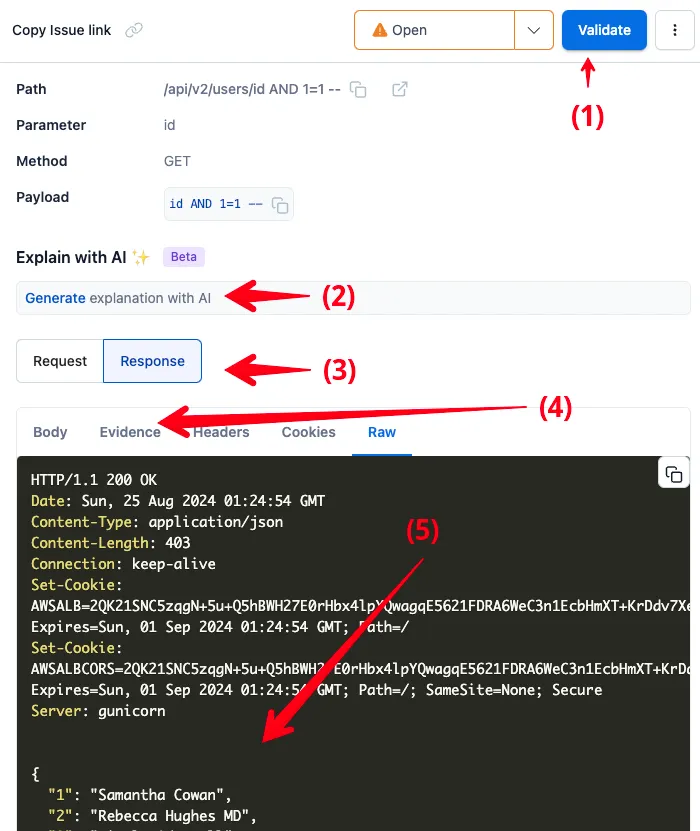
If you’re less familiar with Application Security or pentesting, the first two items are probably most interesting to you.
If you’re an experienced pentester, you’ll probably care more about 3-5.
- Validate with curl: The “Validate button” gives you a
curlcommand that you can run from your machine to replicate the HTTP response, and validate the vulnerability. This can be useful in regression/integration tests. - Explain with AI: The Explain with AI feature will explain the vulnerability in simple terms, how it manifested in this HTTP response, and the impact.
- Request/Response: You can click here to view the HTTP Request used to trigger the vulnerability, or the HTTP Response that shows the response indicating the vulnerability.
- Evidence: The Evidence tab will display information that was reflected in the response or other data that indicates the vulnerability exists, to help with your investigation.
- Raw HTTP response: The raw HTTP request/response body can be viewed in the panel.